Read the ticket analysis report
Open the administrator-only ticket analysis screen, choose how to group it and over which dates, then read what each of the four averages measures.
The Ticket Analysis screen rolls tickets up by team, stage, assignee or priority. This page reads each figure on it and states which tickets every average leaves out.
Goal
A ticket count and four average durations for a date range, and a clear idea of where each average starts counting and where it stops.
Before you begin
- The administrator role. Any other account opening this address is sent straight to Tickets, with no message.
- No entry in the navigation column points at the reports; open
https://<your-domain>/reports/ticketsdirectly. - A workspace with tickets to roll up — see Create a ticket and answer the customer.
- Which column counts as closed is decided by each team's column set: Configure the columns of a team's board.
Steps
Open https://<your-domain>/reports/tickets. The page is headed
Ticket Analysis.
Choose Group by: Team, Stage, Assignee or Priority. The table reloads as soon as you change it.
Choose Status. Open means the ticket has not reached a column marked as closing; Closed means it is sitting in one.
Set From and To to narrow the range. Both filter on the date the ticket was created, not the date it closed.
Read the five tiles at the top: Tickets, Avg close, Avg assign, Avg first response, Avg response. They cover every ticket the filters match.
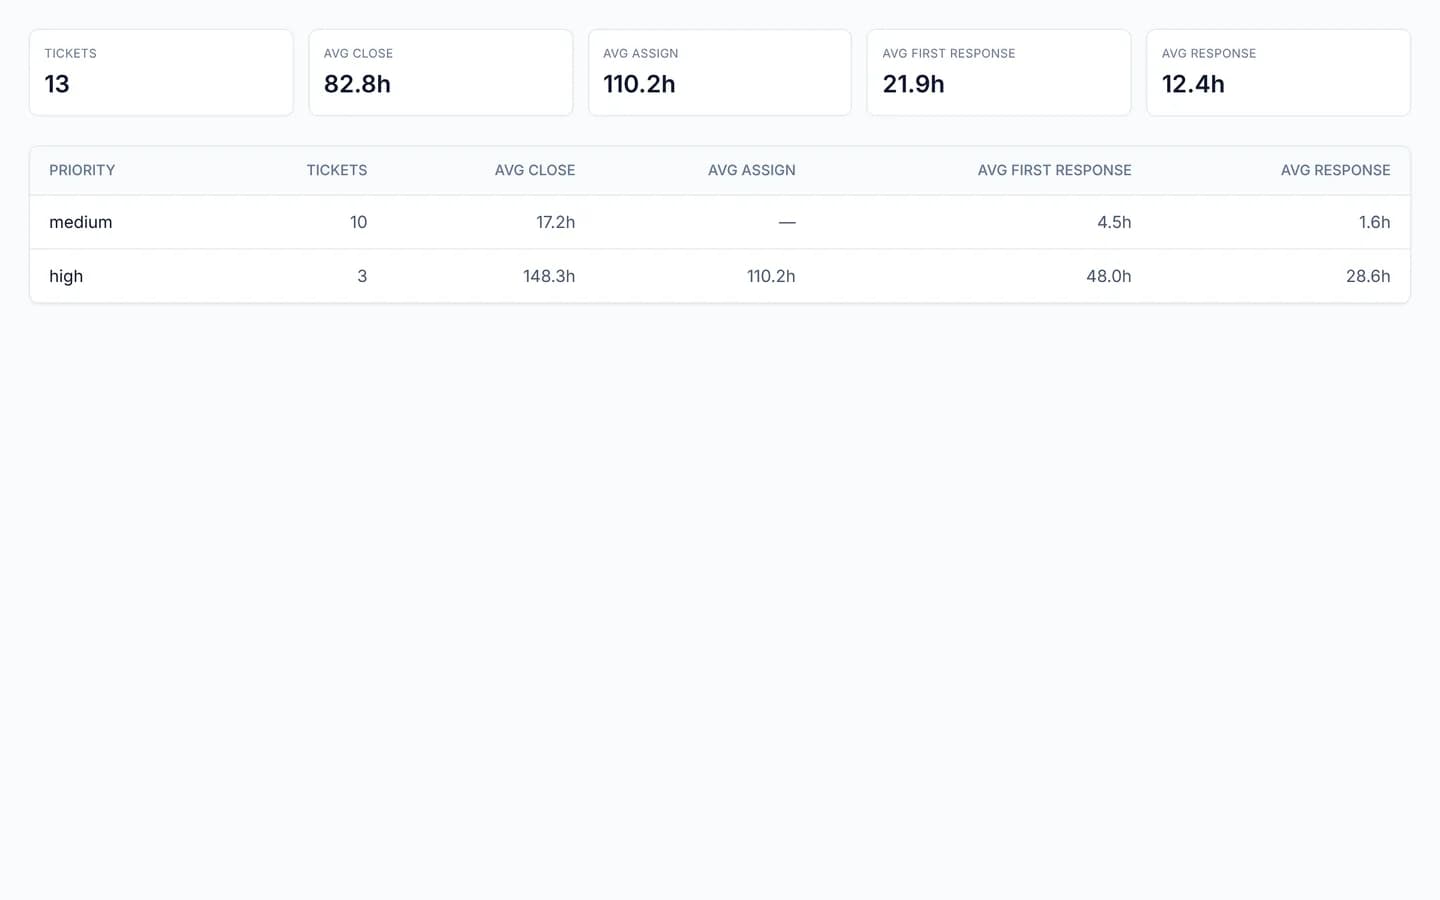
Read the table underneath. The first column is the group key; the other four are the same averages computed inside that group alone.
Read a — as "no ticket in this group carries that figure yet", not as a
zero.
What the four averages measure
| Tile | Starts counting | Stops counting | Left out |
|---|---|---|---|
| Avg close | When the ticket is created | When it enters a column marked as closing | Tickets still open; dragging one back out clears the figure |
| Avg assign | When the ticket is created | The first time it is handed to a person | Tickets never assigned; later reassignments are not recorded |
| Avg first response | The customer's oldest unanswered message | The agent's first public reply | Internal notes, and every later reply |
| Avg response | The same, per exchange | The mean over every exchange answered | Tickets with no reply yet |
These four count wall-clock hours and take nothing off for out-of-hours time. The SLA clock does the opposite — it runs only inside the shifts of a working calendar, so the two report different numbers for one ticket. See Set an SLA policy for a team.
Verify
Set Group by to Priority and Status to All: adding up the Tickets column over every row matches the Tickets tile above.
Set From to a date in the future. The table turns to No data and the
tiles fall to 0 or —, which is the sign the date filter is biting.
Troubleshooting
| Symptom | Cause | What to do |
|---|---|---|
| The first column prints numbers rather than a team, person or column name | The report returns the record id as the group key and the console prints it as it stands | Group by Priority to read words, or match the id against the address of the team's own page |
One row has — as its key | Those tickets carry no team, assignee or stage | Fill that in on the tickets themselves and reload the report |
| Avg close is empty although plenty of work is finished | The team's final column is not marked as a closing one | Fix it in Configure the columns of a team's board |
| To set to today, yet today's tickets are missing | To is read as 00:00 UTC on that date | Set To to the following day |
| The report address lands you back on the ticket list | The account does not carry the administrator role | Ask an administrator to read it for you, or to change your role |
| Avg first response is empty for the busiest group | Those tickets were handled with internal notes and have no public reply | Nothing to correct afterwards; the figure counts public messages only |
Next steps
Create an AI agent and feed it sources
Set up an AI agent in the console, load knowledge sources into it, try a question against it, then link it to the channel you want it answering on.
Read the SLA compliance report
Open the administrator-only SLA report, read compliance for the whole workspace and for each policy, then explain the figures that look wrong.