Read the SLA compliance report
Open the administrator-only SLA report, read compliance for the whole workspace and for each policy, then explain the figures that look wrong.
The SLA Report gathers the SLA status of every ticket into one compliance figure per team and policy. This page reads those figures, including the ones that look wrong and are not.
Goal
Know the current compliance rate for the workspace and for each policy, and know where a low rate came from.
Before you begin
- The administrator role. Any other role opening this address is sent to Tickets, with no explanation.
- Nothing in the navigation column leads here; open
https://<your-domain>/reports/sladirectly. - At least one SLA policy running — see Set an SLA policy for a team.
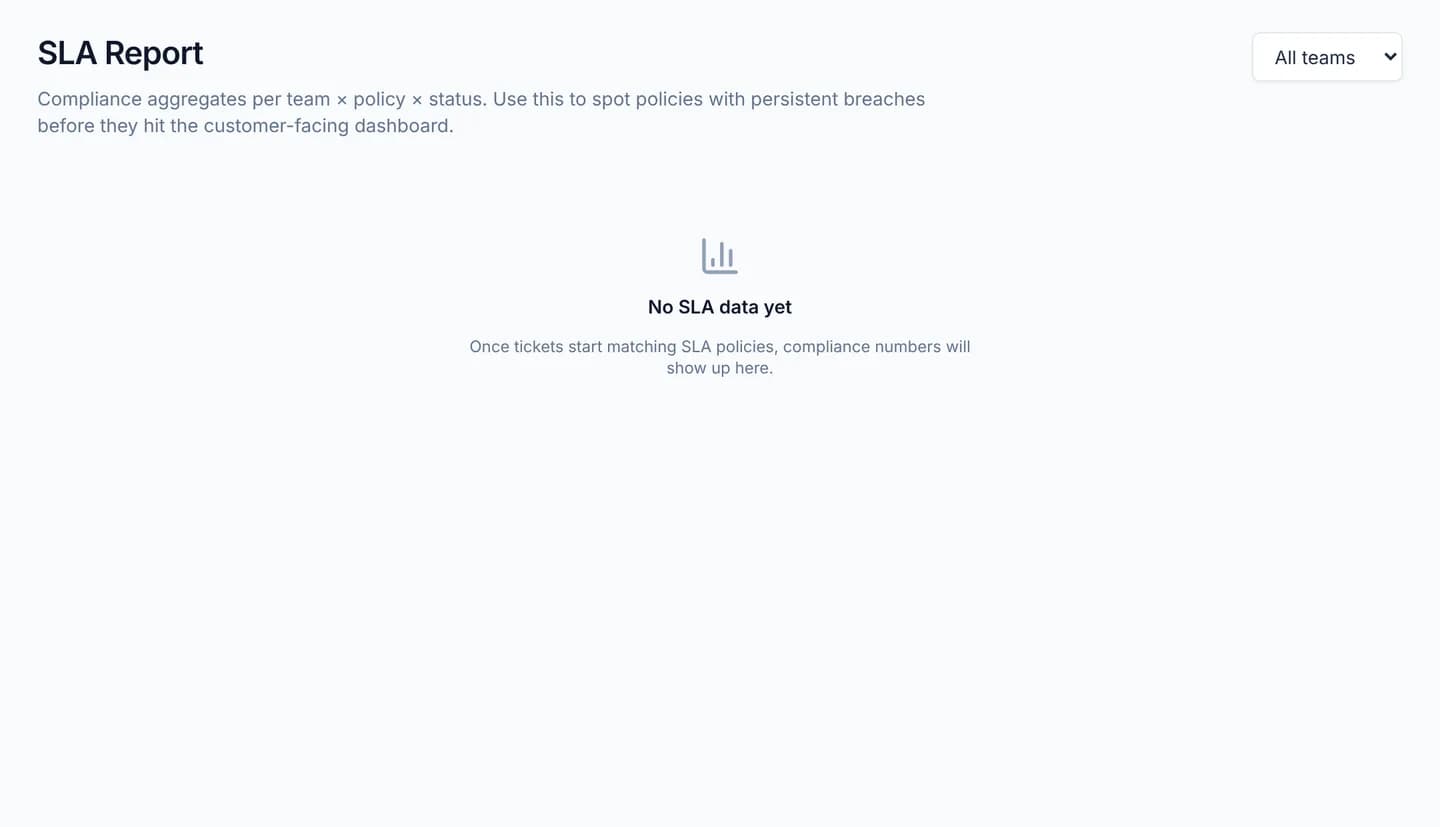
- With no policy attached to any ticket the page shows only No SLA data yet.
Steps
Open https://<your-domain>/reports/sla. The page is headed SLA Report.
Read the four tiles at the top: Total tracked, Compliance, Satisfied, Failed.
Read Compliance as Satisfied divided by Satisfied plus Failed. Tickets still In Progress count for neither side until they resolve.
Narrow the page with the All teams picker on the right if one team is all you need.
Read each card below. The small line is the team, the bold line is the policy, and the right-hand figure is that card's own compliance.
Inside a card each row is one status — In Progress, Satisfied or Failed — with a ticket count and Avg hours to satisfy.
Press the number in the Tickets column to open the ticket list already filtered to that policy.
Take Avg hours to satisfy literally: it exists only on the Satisfied row, and it measures wall-clock hours from ticket creation to the target stage.
Two rules that make figures look odd
Both rules belong to the SLA policy rather than to the report, and are explained on Set an SLA policy for a team. Here is how they surface in the numbers.
A policy with no priority filter attaches to low-priority tickets alone. Its card therefore carries a surprisingly small Total tracked, and the urgent tickets of that same team appear nowhere in the report.
A failed status is permanent. The Failed count never falls, not even after the work is finished, so Compliance rises only on the back of tickets satisfied later.
Verify
Add up the Tickets column across every row of every card: the total matches the Total tracked tile. Add the Satisfied and Failed rows on their own and take the ratio; it matches the Compliance tile.
Pick one team in the filter: the other cards disappear and the four tiles recompute for that team alone.
Troubleshooting
| Symptom | Cause | What to do |
|---|---|---|
| The page shows only No SLA data yet | No ticket matches any policy | Check the priority filter on the policies you have |
| A card counts only a handful of low-priority tickets | The policy left its priority filter empty, so it attaches to low alone | Add policies for the remaining levels |
| Failed does not move although the team caught up | A failed status cannot return | Read the rate as a trend over weeks; it will not fall back on its own |
| A ticket counted as Satisfied turns into Failed | It was dragged out of the target column after the deadline had passed | Check that ticket's stage history |
The Compliance tile prints — | Nothing has resolved yet; everything is still In Progress | Wait until a ticket is satisfied or breaches |
| A policy vanished from the report | It was deleted, and the tracked figures went with it | Keep the old policy and edit it rather than deleting and recreating |